
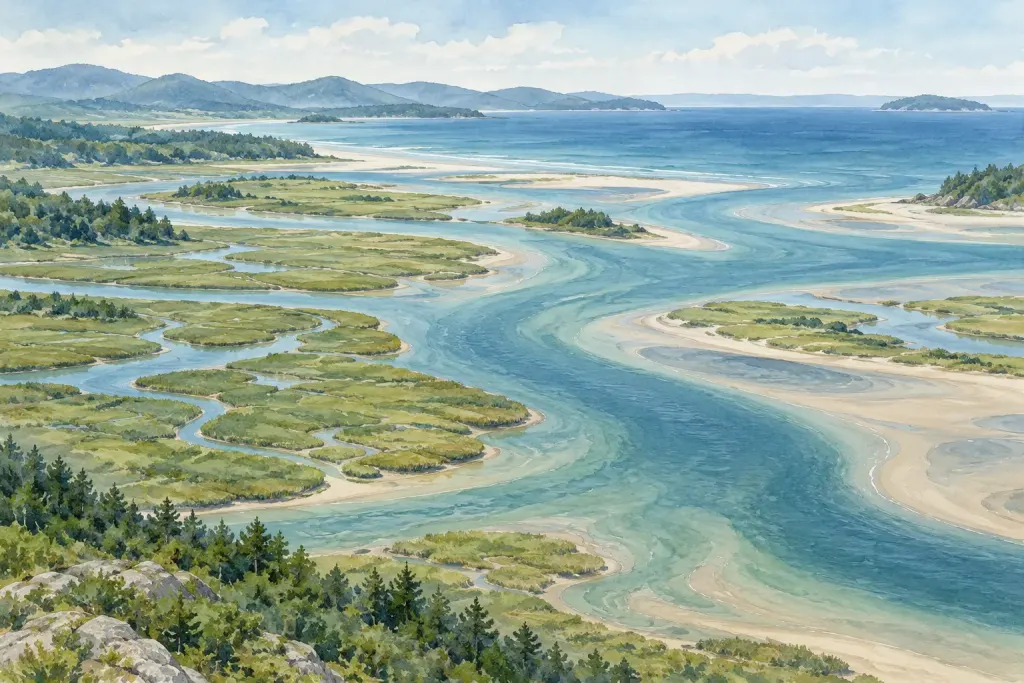
A map divides the coast into neat patches of colour. One stands for a habitat, another for open water, and a thin line appears to settle exactly where one ends. The real landscape may be less tidy than the graphic suggests.
Before using the map to support a claim, read the information around the coloured shapes.
Begin with the legend
Find what each class means and whether the map distinguishes observed, inferred or unclassified areas. An uncoloured patch does not necessarily mean that no habitat exists there; it may reflect a gap in coverage or a category outside the map’s purpose.
Use the publisher’s definitions rather than assigning meaning based on colour alone.
Check when and how the data were collected
The publication date and the survey date may differ. Look for the method, spatial coverage and any stated confidence or limitations. A map compiled from several sources may combine observations from different times.
If that information is unavailable, keep the uncertainty visible in your notes.
Respect the scale
A regional overview can help explain broad relationships while being unsuitable for locating a tiny patch on the ground. Zooming in on a screen does not create additional survey detail.
Ask whether the map was designed for education, planning, scientific analysis or another purpose. Do not use a habitat map as a substitute for navigation information.
Turn the map into a better question
Notice connections worth exploring: a mapped meadow near an estuary, a gap between survey areas or a boundary that differs between editions. Then seek the accompanying report before declaring a change in the habitat.
Our estuary guide and seagrass introduction provide background for two common coastal settings. A map is most informative when you understand the decisions and observations that produced it.